
Labor is one of the biggest drivers of revenue and profitability in an auto repair shop. But measuring labor performance can get confusing quickly.
Technician productivity, labor efficiency, proficiency, and labor utilization are often discussed as if they mean the same thing. They don’t.
Each KPI answers a different question about how your shop turns available technician time into completed work and revenue.
Understanding the difference can help you determine whether a labor problem comes from technician performance, workflow, scheduling, available work, or unused capacity.
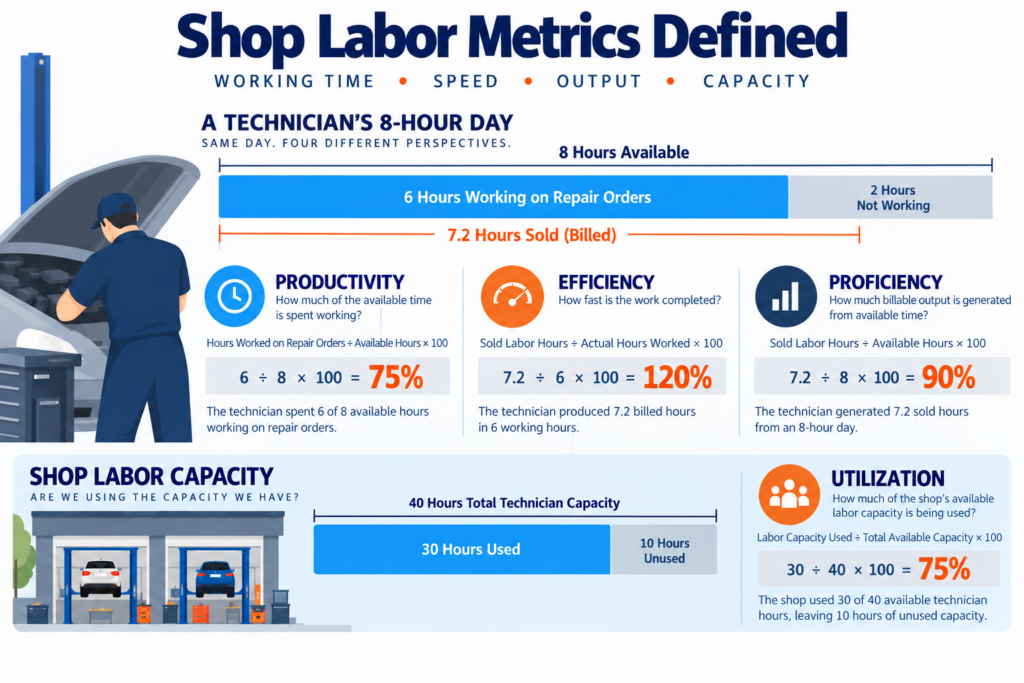
Here is the simplest way to think about the four metrics:
| Metric | The Question It Answers |
|---|---|
| Productivity | How much of the technician’s available time is spent working on repair orders? |
| Efficiency | How quickly does the technician complete the work compared with the labor hours sold? |
| Proficiency | How many sold hours does the technician generate from their total available time? |
| Utilization | How much of the shop’s available labor capacity is actually being used? |
An easy way to remember them is:
Productivity = Working Time
Efficiency = Speed
Proficiency = Output
Utilization = Capacity
The real value comes from understanding how these four metrics work together.
What Is Technician Productivity?
Technician productivity measures how much of a technician’s available time is actually spent working on repair orders.
Technician Productivity Formula
Productivity = Hours Worked on Repair Orders ÷ Available Hours × 100
Suppose a technician is available for 8 hours but spends only 6 hours actively working on repair orders.
6 ÷ 8 = 75% productivity
That means the technician spent 75% of the available day working on repair orders. The remaining 25% was spent somewhere else.
What Does Productivity Tell You?
Productivity helps identify how effectively the shop keeps work in front of its technicians.
Lost productivity can come from:
- Waiting for parts
- Waiting for customer approvals
- Lack of vehicles
- Poor dispatching
- Moving vehicles
- Searching for tools or equipment
- Administrative work
- Interruptions
- Scheduling gaps
This distinction is important because low productivity isn’t automatically a technician problem.
A technician may be ready and capable of working but spend two hours waiting for another vehicle.
The technician’s productivity suffers, but the root cause could be scheduling, dispatching, parts availability, customer approvals, or insufficient car count.
Productivity tells us how much of the day was spent working.
It doesn’t tell us how efficiently the technician performed during those working hours.
For that, we need labor efficiency.
What Is Labor Efficiency?
Labor efficiency measures how quickly a technician completes work compared with the labor hours sold or allowed for that work.
Labor Efficiency Formula
Labor Efficiency = Sold Labor Hours ÷ Actual Hours Worked × 100
Let’s continue with the same technician.
The technician spent 6 hours working on repair orders during the 8-hour day.
During those 6 hours, the technician produced 7.2 sold labor hours.
7.2 ÷ 6 = 120% efficiency
The technician produced 7.2 billed hours in 6 actual working hours.
What Does Labor Efficiency Tell You?
Efficiency tells you how effectively a technician converts actual working time into billed labor hours.
Higher efficiency can be influenced by:
- Technician experience and skill
- Good tools and equipment
- Accurate diagnostics
- Familiarity with the vehicle or repair
- Parts availability
- Good shop processes
Low efficiency can point toward training problems, difficult jobs, inadequate equipment, inaccurate labor times, poor processes, or other obstacles that make jobs take longer than expected.
This is where productivity and efficiency begin to tell a more complete story.
Our example technician has:
75% productivity
but
120% efficiency
If you only looked at productivity, you might assume the technician was underperforming.
But the efficiency number tells us something different.
When the technician has work in front of them, they perform very well.
The bigger opportunity may be keeping the technician working for more of the available day.
That brings us to proficiency.
What Is Technician Proficiency?
Proficiency takes a broader view of technician output.
Instead of looking only at working time or how quickly jobs are completed, proficiency compares the technician’s total sold labor hours with their total available time.
Technician Proficiency Formula
Proficiency = Sold Labor Hours ÷ Available Hours × 100
Using the same technician:
- Available time: 8 hours
- Actual time working on repair orders: 6 hours
- Sold labor hours: 7.2 hours
The technician’s proficiency is:
7.2 ÷ 8 = 90% proficiency
The technician generated 7.2 sold hours from an 8-hour available day.
How Productivity, Efficiency, and Proficiency Work Together
This is where the relationship between the first three labor metrics becomes especially useful.
Our technician produced:
Productivity
6 working hours ÷ 8 available hours = 75%
Efficiency
7.2 sold hours ÷ 6 working hours = 120%
Proficiency
7.2 sold hours ÷ 8 available hours = 90%
There is also a useful mathematical relationship:
Productivity × Efficiency = Proficiency
In this example:
75% × 120% = 90%
Think about what that tells us.
The technician is producing billed hours at 120% efficiency while actively working.
But the technician is only productive for 75% of the available day.
The result is 90% proficiency.
That gives us a much clearer picture than any one of those numbers could provide by itself.
Productivity tells us whether the technician is working.
Efficiency tells us how effectively they perform while working.
Proficiency tells us the total output produced from the available day.
But there is still another question we need to answer.
Does the shop have enough work to use all of the technician capacity it has available?
That is where labor utilization comes in.
What Is Labor Utilization?
Labor utilization takes the analysis beyond an individual technician and looks at how effectively the shop is using its total available labor capacity.
A simple way to calculate it is:
Labor Utilization = Labor Capacity Used ÷ Total Available Labor Capacity × 100
Suppose your technicians provide 40 hours of available labor capacity today, but the shop only has enough work to use 30 hours.
30 ÷ 40 = 75% utilization
That leaves approximately 10 hours of unused labor capacity.
A Note About Labor Utilization
There isn’t one universal definition of labor utilization used across every auto repair shop or shop management system.
Some systems may define available capacity or utilized hours differently.
Before comparing utilization between reports, locations, or industry benchmarks, make sure you understand how your shop management system calculates the metric.
For this article, utilization refers to the percentage of total available technician labor capacity that is being put to use.
What Does Labor Utilization Tell You?
Utilization helps determine whether the shop has enough work, and the right work at the right time, to use the labor capacity it already has.
Low utilization can be connected to:
- Low car count
- Scheduling gaps
- Poor appointment distribution
- Insufficient work sold
- Too much technician capacity for current demand
- Poor dispatching
- Customers declining recommended work
- Cancellations and no-shows
- Vehicles not being ready when technicians become available
This creates an important distinction.
A shop can have highly efficient technicians and still have poor labor utilization.
Your technicians may perform exceptionally well whenever a vehicle is in front of them. But if there aren’t enough vehicles or enough approved work, that efficiency cannot produce revenue.
Productivity vs. Efficiency vs. Proficiency vs. Utilization
Now we can put all four metrics together.
| Metric | Compares | Primary Question | Potential Problem |
|---|---|---|---|
| Productivity | Working hours vs. available hours | How much available time is spent working? | Technicians spend too much time waiting |
| Efficiency | Sold hours vs. actual working hours | How quickly is the work being completed? | Jobs take too long |
| Proficiency | Sold hours vs. available hours | How much billable output comes from the technician’s day? | Not enough sold hours are being generated |
| Utilization | Used capacity vs. total capacity | Are we using the labor capacity we have? | Empty bays or unused technician capacity |
Remember:
Productivity = Working Time
Efficiency = Speed
Proficiency = Output
Utilization = Capacity
Together, these metrics help explain how effectively your shop converts technician capacity into sold labor hours.
Why Looking at One Labor KPI Can Be Misleading
One of the biggest mistakes a shop can make is evaluating labor performance based on a single KPI.
Consider a few different situations.
Low Productivity + High Efficiency
The technician completes jobs quickly but spends too much of the day waiting for work.
The problem could be scheduling, dispatching, parts availability, customer approvals, or insufficient car count.
High Productivity + Low Efficiency
The technician stays busy throughout the day but takes longer than expected to complete jobs.
This may point toward technician training, equipment, difficult repairs, inaccurate labor times, or inefficient repair processes.
High Productivity + High Efficiency
The technician consistently has work available and completes that work efficiently.
This is generally the combination you want to see because strong productivity and efficiency work together to produce strong proficiency.
Strong Technician Performance + Low Shop Utilization
Your technicians perform well when vehicles are available, but the shop isn’t generating or scheduling enough work to use all of its available labor capacity.
This isn’t primarily a technician problem.
It is a capacity and demand problem.
That distinction matters because each problem requires a different solution.
Use Labor KPIs to Diagnose the Problem
Instead of treating these numbers as a technician scorecard, use them as diagnostic tools.
If productivity is low, investigate dispatching, parts delays, customer approvals, interruptions, vehicle availability, and scheduling.
If efficiency is low, investigate technician skill, tools, job complexity, estimating accuracy, repair processes, and workflow.
If proficiency is low, look at both productivity and efficiency. One or both will usually help explain why the technician isn’t generating enough sold hours from the available day.
If utilization is low, investigate scheduling, car count, customer demand, work sold, staffing levels, and available shop capacity.
This changes the question from:
“Which technician is the problem?”
to:
“Where is the constraint in our labor system?”
That is a much more useful question.
Don’t Use Labor KPIs to Blame Technicians
Labor KPIs should help diagnose your operation, not simply grade your technicians.
Imagine a technician spends two hours waiting for parts.
Their productivity suffers.
But is that a technician performance problem?
Probably not.
Or imagine a technician has no vehicle to work on for part of the afternoon because the shop’s appointment volume was low.
Again, productivity suffers. But the technician can’t repair a vehicle that isn’t there.
The same thing can happen with utilization.
You can have a shop full of talented technicians producing at excellent efficiency levels while still leaving significant revenue on the table because there isn’t enough approved work to use the available capacity.
That is why labor metrics need context.
Go Beyond the KPI: Understand What Is Driving Labor Performance
Knowing your productivity, efficiency, proficiency, and utilization tells you what happened.
The next question is often more meaningful:
Why did it happen?
That is where connecting labor performance with customer, appointment, and revenue data becomes important.
HiBeam helps shops connect these different pieces of the business so they can better understand the factors contributing to unused capacity and lost production.
For example, low productivity or utilization may be connected to:
- Too few appointments scheduled for available capacity
- Appointment cancellations or no-shows
- Customers who haven’t returned when expected
- Recommended services that haven’t converted into visits
- Declined work that was never recovered
- Customer segments with declining visit frequency
- Gaps in customer follow-up
- Demand that isn’t aligned with available shop capacity
Instead of stopping at:
“Our utilization was 75%.”
The more useful question becomes:
“Why did 25% of our available capacity go unused?”
That is where the KPI starts becoming actionable.
From Unused Capacity to Customer Opportunity
Suppose your shop has 40 technician hours of available capacity tomorrow, but only 30 hours of scheduled work.
Your current utilization is:
30 ÷ 40 = 75%
That means you have approximately 10 hours of unused capacity.
Knowing that is helpful.
But knowing you have 10 open hours doesn’t fill them.
The next step is identifying where additional work could come from.
HiBeam can help shops identify customer opportunities connected to that available capacity, including customers with:
- Recommended services due
- Previously declined services
- Upcoming maintenance needs
- Lapsed visit patterns
- Recent engagement with shop communications
- No future appointment scheduled
Instead of treating these customers as one large marketing list, the shop can identify the customers who represent the most relevant opportunity and communicate with them accordingly.
The process becomes:
Measure the gap → Understand the cause → Identify the opportunity → Take action → Measure the result
This is where labor analytics starts connecting directly to customer retention and revenue growth.
Labor Performance Is Bigger Than Labor Data
Labor performance doesn’t exist in isolation.
Changes in technician output can be connected to changes elsewhere in the business.
That is why labor KPIs should be viewed alongside metrics such as:
- Car count
- Average repair order
- Labor sales
- Effective labor rate
- Labor hours per repair order
- Technician capacity
- Appointment capacity
- Customer retention
- Recommended services
- Declined services
- Appointment cancellations
- No-shows
Looking at these metrics together makes it easier to distinguish between a technician performance problem and a customer demand problem.
For example, declining proficiency combined with strong technician efficiency could point toward lower productivity.
Lower productivity combined with declining car count could point toward insufficient demand.
Strong demand combined with poor utilization could point toward scheduling or workflow problems.
Each layer of data helps narrow the possible cause.
From Reporting Labor KPIs to Understanding Them
Traditional reporting is very good at telling you what happened.
Productivity dropped.
Efficiency improved.
Proficiency declined.
Utilization fell.
But knowing what happened is only the beginning.
The harder question is why.
HiBeam is designed to connect operational performance with customer behavior so shops can analyze labor performance alongside appointments, customer retention, recommended services, declined work, communication, and revenue.
Instead of simply reviewing another dashboard, the goal is to be able to ask questions such as:
- Why was labor utilization lower this month?
- Why did technician productivity decline last week?
- Which days consistently have unused capacity?
- Are cancellations and no-shows contributing to lost technician hours?
- Which customer segments could help fill upcoming capacity?
- How much potential labor opportunity is tied to customers with recommended services?
- Are declining customer visit rates contributing to lower labor production?
- Which customers represent the best opportunity to fill available capacity next week?
This changes analytics from simply reporting numbers to diagnosing opportunities.
Measure the System, Not Just the Technician
Productivity, efficiency, proficiency, and utilization each tell you something different about your shop.
Remember the four questions:
Productivity: How much of our available technician time are we actually working?
Efficiency: How quickly are we completing the work?
Proficiency: How much billable output are we generating from available technician time?
Utilization: How much of our total labor capacity are we putting to work?
Don’t stop at the KPI.
Look at the relationship between the numbers and use them to identify where the constraint actually exists.
Your KPIs can tell you what happened.
HiBeam helps connect customer, appointment, retention, communication, and revenue data so you can better understand why it happened and where the next opportunity may be.
To learn more schedule a demo today
More Customers. Better Relationships. Higher Sales.
Author: Chris Matson is the Founder of HiBeam and an experienced automotive business and marketing professional. Since 2009, he has owned and operated independent auto repair shops while building an automotive-focused marketing agency. Earlier in his career, he served as CFO of a broadcast television group, adding financial and business leadership experience to his hands-on automotive and marketing background. Chris writes about automotive marketing, customer retention, communication, and strategies that help repair shops grow revenue.