
Running an auto repair shop creates a huge amount of data.
Every repair order, estimate, labor hour, declined service, appointment, customer visit, phone call, and payment tells you something about the performance of your business.
The problem is that having data isn’t the same as understanding it.
Many shops focus heavily on three numbers: revenue, car count, and Average Repair Order (ARO). Those numbers are important, but they don’t necessarily tell you why your shop is performing the way it is.
Revenue might be growing while gross profit is falling. ARO might be increasing while customer retention is declining. Technician efficiency might look great while technicians spend too much of the day waiting for work.
That’s why successful shop management requires looking at the relationships between your Key Performance Indicators (KPIs), not just individual numbers on a report.
The best KPIs don’t just tell you what happened. They help you understand why it happened and where you should look next.
What Are the Most Important Auto Repair Shop KPIs?
The most important auto repair shop KPIs include revenue, car count, Average Repair Order (ARO), close ratio, gross profit, technician productivity, technician efficiency, technician proficiency, Effective Labor Rate, customer retention, Customer Lifetime Value, Customer Acquisition Cost, and Return on Ad Spend.
These metrics become much more useful when evaluated together rather than individually.
In this guide, we’ll break them into five areas:
- Sales
- Labor
- Profitability
- Customers
- Marketing
What Is a KPI in an Auto Repair Shop?
A Key Performance Indicator, or KPI, is a measurable value used to evaluate how effectively your shop is achieving a specific business objective.
Not every metric is necessarily a KPI.
For example, hours billed is a metric. When you compare hours billed against available technician hours to calculate technician proficiency, you’re using those metrics to evaluate how effectively your shop is using its labor capacity.
The same thing happens throughout your business.
Revenue tells you how much you sold. Car count helps explain how many repair orders contributed to that revenue. ARO tells you how much revenue the average repair order produced. Close ratio can help explain how effectively your team converted identified opportunities into sales.
Together, those numbers tell a much more complete story.
Auto Repair Shop KPI Quick Reference
| KPI | Formula |
|---|---|
| Average Repair Order (ARO) | Revenue ÷ Repair Orders |
| Hours Sold Per Repair Order | Total Labor Hours Sold ÷ Repair Orders |
| Close Ratio | Sold Opportunity ÷ Presented Opportunity |
| Discount Rate | Discount Dollars ÷ Pre-Discount Sales |
| Technician Productivity | Hours Worked on ROs ÷ Hours Clocked |
| Technician Efficiency | Hours Billed ÷ Hours Worked on ROs |
| Technician Proficiency | Hours Billed ÷ Available Hours |
| Effective Labor Rate (ELR) | Total Labor Revenue ÷ Total Available Hours |
| Gross Profit % | Gross Profit ÷ Sales |
| Gross Profit Per RO | Gross Profit ÷ Repair Orders |
| Revenue Per Billed Hour | Revenue ÷ Hours Billed |
| Gross Profit Per Billed Hour | Gross Profit ÷ Hours Billed |
| Gross Profit Per Available Hour | Gross Profit ÷ Available Hours |
| Customer Retention Rate | Returning Customers ÷ Eligible Customers |
| Customer Lifetime Value (CLV) | Customer Value Over the Relationship* |
| Cost Per Lead (CPL) | Marketing Spend ÷ Leads |
| Lead-to-Appointment Rate | Appointments ÷ Leads |
| Appointment-to-RO Rate | Repair Orders ÷ Appointments |
| Customer Acquisition Cost (CAC) | Marketing Spend ÷ New Customers Acquired |
| Return on Ad Spend (ROAS) | Attributed Revenue ÷ Advertising Spend |
*CLV can be calculated several ways depending on the available customer history and methodology.
KPIs Need Context
One of the biggest mistakes you can make is evaluating a KPI completely by itself.
Imagine your revenue increased 10% this year.
That’s good, right?
Maybe.
What if car count increased 25% to produce that 10% revenue increase?
What if gross profit percentage declined?
What if discounts increased significantly?
What if customer retention decreased?
The revenue number tells you what happened.
The related KPIs help you understand why it happened.
That’s an important distinction to remember as you evaluate the following metrics.
Auto Repair Shop Sales KPIs
Sales KPIs measure how effectively your shop converts customer demand and repair opportunities into revenue.
Revenue
Revenue is one of the most obvious measurements of shop performance.
At its simplest:
Revenue = Total Qualifying Sales During the Measurement Period
Revenue should be monitored over time rather than viewed as an isolated number.
Useful comparisons include:
- Month over month
- Same month last year
- Year over year
- Rolling 12 months
More importantly, look at what is causing revenue to change.
Revenue can increase because you have more vehicles coming through the shop, your ARO increased, labor rates increased, your close ratio improved, or customers purchased more services.
Understanding the cause matters just as much as knowing the total.
Car Count
Car count measures the number of qualifying repair orders or customer visits during a period.
It’s one of the most commonly discussed metrics in the automotive repair industry, but more cars aren’t automatically better.
Consider the basic relationship:
Revenue = Car Count × Average Repair Order
A shop doing 500 repair orders at a $500 ARO produces $250,000 in revenue.
A shop doing 350 repair orders at an $800 ARO produces $280,000.
The second shop processes 150 fewer repair orders while generating more revenue.
Car count needs to be evaluated alongside ARO, available capacity, close ratio, profitability, and customer retention.
Average Repair Order (ARO)
Average Repair Order measures the average revenue generated by each repair order.
ARO = Revenue ÷ Repair Orders
ARO can be influenced by many factors, including:
- Vehicle mix
- Labor rates
- Inspection processes
- Service advisor performance
- Close ratio
- Maintenance opportunities
- Repair complexity
- Parts pricing
- Service mix
An increasing ARO can be positive, but it shouldn’t automatically be interpreted as improved sales performance.
For example, ARO could increase while car count and close ratio decline. You need the surrounding metrics to understand what’s really happening.
Hours Sold Per Repair Order
Hours Sold Per Repair Order measures the average labor hours sold on each repair order.
Hours Sold Per Repair Order = Total Labor Hours Sold ÷ Repair Orders
If your shop sells 600 labor hours across 200 repair orders:
600 ÷ 200 = 3.0 Hours Sold Per Repair Order
This metric adds context to ARO by showing how much labor work is being sold per vehicle. If ARO increases while hours sold per RO stays flat, the increase may be coming from labor rates, parts pricing, or service mix rather than additional work sold.
Track it alongside ARO, close ratio, hours billed, and available technician capacity.
Close Ratio
Close ratio measures how effectively your shop converts identified opportunities into sales.
Close Ratio = Sold Opportunity ÷ Presented Opportunity
The important part is defining “opportunity.”
A shop might measure close ratio using estimate dollars, recommended service dollars, individual jobs, or labor hours.
Whatever method you choose, use the same definition consistently.
A shop can have plenty of vehicles coming through the doors but still leave significant revenue on the table if identified work isn’t being approved.
Discount Rate
Discount rate measures how much potential revenue is being reduced through discounts.
Discount Rate = Discount Dollars ÷ Pre-Discount Sales
Discounting isn’t necessarily bad. Shops may have legitimate reasons to offer promotions, loyalty incentives, fleet pricing, or other discounts.
The problem occurs when discounts become large enough to hide weaknesses in pricing or sales processes.
That’s why discount rate should be evaluated alongside revenue, ARO, Effective Labor Rate, and gross profit.
Auto Repair Shop Labor KPIs
Labor is one of the most valuable and limited resources inside an auto repair shop.
You can’t inventory unused technician hours and sell them next month. Once that capacity is gone, it’s gone.
The goal isn’t simply to make technicians work faster. It’s to understand how effectively available technician capacity is being converted into productive work, billed hours, revenue, and gross profit.
Productivity, efficiency, proficiency, and utilization measure different parts of labor performance. For a deeper explanation of how they work together, read our guide to technician productivity, efficiency, proficiency, and utilization.
Hours Billed
Hours billed are the labor hours sold to customers.
If a repair operation pays 3.0 labor hours, those three hours become billed hours when the work is sold and completed according to your reporting rules.
Hours billed represent output. They do not necessarily represent how long the technician actually spent performing the repair.
Hours Worked
Hours worked represent the actual technician time spent actively working on repair orders.
A technician might complete eight billed hours of work in six actual working hours.
That relationship helps us measure efficiency.
Hours Clocked
Hours clocked represent the total amount of time a technician is clocked into work.
Not all clocked time is necessarily spent actively repairing vehicles.
Technicians may spend time waiting for parts, waiting for work, attending meetings, cleaning, performing administrative tasks, or handling other responsibilities.
Comparing hours worked with hours clocked helps you understand how much of the technician’s day is being spent actively performing repair work.
Available Hours
Available hours represent the technician capacity available to the shop during a measurement period.
This provides a broader view of labor capacity and becomes particularly useful when measuring whether your shop is converting its available technician resources into billed output.
Technician Productivity
Technician productivity measures how much clocked technician time is spent actively working on repair orders.
Technician Productivity = Hours Worked on ROs ÷ Hours Clocked
If a technician is clocked in for eight hours but spends six hours actively working on repair orders:
6 ÷ 8 = 75% Productivity
Low productivity doesn’t necessarily mean the technician is the problem.
The technician could be waiting for parts, approvals, another vehicle, or dealing with scheduling and workflow problems.
That’s why productivity needs context.
Technician Efficiency
Technician efficiency measures job speed relative to the labor hours billed.
Technician Efficiency = Hours Billed ÷ Hours Worked on ROs
Suppose a technician produces 7.2 billed hours while spending six hours actively working on those repair orders.
7.2 ÷ 6 = 120% Efficiency
A highly efficient technician can still have poor overall output if they don’t have enough work to perform.
Technician Proficiency
Technician proficiency measures billed output across available technician capacity.
Technician Proficiency = Hours Billed ÷ Available Hours
If eight technician hours were available and 6.4 hours were billed:
6.4 ÷ 8 = 80% Proficiency
This provides a broader picture of how effectively the shop is converting available technician capacity into billed hours.
Labor Utilization
Labor utilization provides another view of how effectively available labor capacity is being used.
The exact definition should remain consistent within your reporting system because different organizations may use labor terminology differently.
The important point is that productivity, efficiency, proficiency, and utilization are not interchangeable measurements.
A technician could have excellent efficiency but poor productivity.
That might mean the technician works quickly when assigned work but spends too much of the day without productive repair work.
In that situation, telling the technician to work faster doesn’t solve the problem.
The real issue might be scheduling, parts availability, dispatching, sales, or another shop bottleneck.
Effective Labor Rate
Effective Labor Rate (ELR) measures how much labor revenue your shop generates from its available technician capacity.
Effective Labor Rate = Total Labor Revenue ÷ Total Available Hours
For example, if your shop generates $12,000 in labor revenue from 80 available technician hours:
$12,000 ÷ 80 = $150 Effective Labor Rate
ELR connects labor sales with available capacity, helping you understand how effectively your shop is turning technician hours into labor revenue.
Because ELR is influenced by several parts of the operation, it should be evaluated alongside labor rates, hours billed, productivity, efficiency, proficiency, discounts, and labor mix.
For a deeper explanation, read our guide to Effective Labor Rate for auto repair shops.
Auto Repair Shop Profitability KPIs
Revenue answers:
How much did we sell?
Profitability asks a more important question:
How much did we actually make?
A shop can generate impressive revenue while producing disappointing profit.
That’s why profitability KPIs need to sit alongside your sales metrics.
Gross Profit Dollars
Gross profit measures the amount remaining after subtracting the direct cost associated with producing the sale.
Gross Profit = Sales − Cost of Goods Sold
Revenue growth without corresponding gross profit growth should trigger further investigation.
Gross Profit Percentage
Gross profit percentage measures gross profit relative to sales.
Gross Profit % = Gross Profit ÷ Sales
Shops should consider evaluating gross profit separately across major categories such as:
- Labor
- Parts
- Tires
- Overall shop sales
For parts, it’s also useful to look deeper than your overall parts margin. Break down parts gross profit by part type and source.
For example, compare:
- Dealer vs. non-dealer parts
- OEM vs. aftermarket parts
- Parts supplier or vendor
- Parts category or service type
Your overall parts margin might look healthy while dealer-sourced parts, a particular vendor, or certain types of parts consistently produce much lower margins.
Breaking gross profit down this way helps identify where purchasing costs, pricing, discounts, vendor selection, or sales mix are affecting profitability and where there may be opportunities to improve margin.
Gross Profit Per Repair Order
Gross profit per repair order adds profitability context to ARO.
Gross Profit Per RO = Gross Profit ÷ Repair Orders
Imagine two shops both have an $800 ARO.
That doesn’t mean those repair orders are equally valuable.
If one shop produces significantly more gross profit from each $800 repair order, the financial performance of the two businesses is very different.
Revenue Per Billed Hour
Revenue per billed hour measures how much revenue the shop generates relative to billed labor output.
Revenue Per Billed Hour = Revenue ÷ Hours Billed
This helps normalize revenue against labor production rather than simply looking at total sales.
Gross Profit Per Billed Hour
Gross profit per billed hour takes that concept another step.
Gross Profit Per Billed Hour = Gross Profit ÷ Hours Billed
Instead of asking only how much revenue was generated, you’re looking at how much gross profit was produced for every billed hour.
Gross Profit Per Available Hour
You can broaden the analysis even further by asking:
How much gross profit are we generating from the labor capacity available to the business?
Gross Profit Per Available Hour = Gross Profit ÷ Hours Available
This connects labor performance with financial performance and illustrates why the most useful KPIs frequently cross traditional reporting categories.
Customer Retention and Customer KPIs
Most shop management systems are built around repair orders.
But repair orders don’t return to your shop.
Customers do.
Customer KPIs help you understand the behavior and value of the people behind those repair orders.
New Customers
New customer count measures customers making their first qualifying visit to your shop.
Acquiring new customers is necessary for growth, but new customer count shouldn’t be evaluated by itself.
You also need to know:
- What did it cost to acquire them?
- How much did they spend?
- Did they return?
- How frequently did they return?
- What did they become worth over time?
A shop that constantly acquires new customers but rarely gets them back may simply be filling a leaky bucket.
Repeat Customers
Repeat customers are customers who return after a previous qualifying visit.
Tracking repeat customers helps separate true customer relationships from one-time transactions.
A growing shop generally needs both customer acquisition and customer retention. Learn more about how a CRM can increase repeat customers for an auto repair shop and how to build a repeatable customer pipeline.
Customer Retention Rate
Customer retention measures how effectively your shop gets customers to return over time.
The exact calculation requires a consistent definition of what qualifies as a return and the time period being measured.
Retention becomes especially powerful when analyzed by customer cohort.
For example, you might compare retention by:
- First visit month
- Location
- Marketing source
- Service advisor
- Customer type
Instead of simply asking, “What’s our retention rate?” you can start asking:
Which groups of customers are most likely to return?
And:
Where are we losing customers?
For strategies focused specifically on this metric, see our guide on how to improve customer retention.
Visit Frequency
Visit frequency measures how often customers return to your shop.
Two shops could have similar retention rates while generating very different customer value because customers at one shop return more frequently.
Visit frequency therefore needs to be considered alongside retention and ARO.
Customer Lifetime Value
Customer Lifetime Value (CLV) attempts to measure the economic value a customer generates throughout their relationship with your shop.
At a conceptual level, customer value is influenced by the relationship between:
ARO × Visit Frequency × Customer Retention
A customer with a relatively modest first repair order could ultimately be much more valuable than a customer with one large repair who never returns.
This is one reason judging marketing performance entirely from the first repair order can be misleading.
Active, Lapsed and Lost Customers
Not every customer who hasn’t visited recently should be treated the same.
There is an important difference between a customer who is active, one who is beginning to lapse, and one who appears to be lost.
Understanding the difference between lapsed and lost customers allows you to identify customers who may be moving away from the shop before the relationship disappears completely.
The more useful question becomes:
How much of our customer base is moving toward becoming lost?
Declined and Recommended Service Opportunity
Your existing customer base may also contain a significant amount of future revenue opportunity.
Useful measurements can include:
- Total declined service value
- Actionable declined service value
- Recommended service opportunity
- Recovered declined revenue
- Declined service recovery rate
Instead of treating a declined recommendation as the end of the sales process, the shop can treat it as a future customer opportunity.
The right follow-up strategy can also help you recover declined work without repeatedly sending customers generic reminders.
Auto Repair Shop Marketing KPIs
Clicks, impressions, phone calls, and leads are useful marketing metrics.
But ultimately, an auto repair shop needs to answer a much more important question:
Did the marketing create profitable customers?
Leads
The first step is deciding what your shop considers a lead.
Depending on the marketing channel, leads could include:
- Phone calls
- Website forms
- Appointment requests
- Text messages
- Other customer inquiries
Use a consistent definition so you can make meaningful comparisons over time.
Cost Per Lead
Cost per lead measures the average advertising cost required to generate a lead.
Cost Per Lead = Marketing Spend ÷ Leads
CPL is useful, but it doesn’t tell you anything about lead quality.
A campaign producing $20 leads isn’t necessarily better than one producing $50 leads if the more expensive leads are much more likely to become paying customers.
Lead-to-Appointment Rate
This metric measures how effectively leads turn into appointments.
Lead-to-Appointment Rate = Appointments ÷ Leads
This is where marketing performance begins intersecting with front-office performance.
If leads are increasing but appointments aren’t, the advertising campaign may not necessarily be the problem.
The issue could be call handling, response time, scheduling availability, or lead quality.
Customer Acquisition Cost
Customer Acquisition Cost measures how much marketing spend is required to acquire a new customer.
CAC = Marketing Spend ÷ New Customers Acquired
This is different from cost per lead.
A $30 lead that rarely becomes a customer could ultimately be more expensive than a $70 lead that frequently converts.
Return on Ad Spend
Return on Ad Spend measures attributed revenue relative to advertising spend.
ROAS = Attributed Revenue ÷ Advertising Spend
If you spend $10,000 on advertising and can attribute $50,000 in revenue to those campaigns:
$50,000 ÷ $10,000 = 5.0, or 500% ROAS
Whenever possible, shops should connect marketing attribution to actual completed repair orders rather than treating calls, clicks, or appointments as revenue.
For a deeper explanation of attribution and calculation, read our guide to Return on Ad Spend for auto repair shops.
Revenue by Marketing Source
Once attribution reaches actual customers and repair orders, you can compare revenue generated by sources such as:
- Google Ads
- Google Local Services Ads
- Organic search
- Google Business Profile
- Meta
- Referrals
- Direct traffic
- Existing customer campaigns
But even revenue by source doesn’t tell the complete story.
There is a difference between customer acquisition revenue and customer lifetime revenue.
A marketing source might produce a lower first-visit ARO while generating customers with excellent retention and lifetime value.
If you’re only looking at the first repair order, you may underestimate the true value of that marketing source.
Why Auto Repair Shop KPIs Should Be Connected
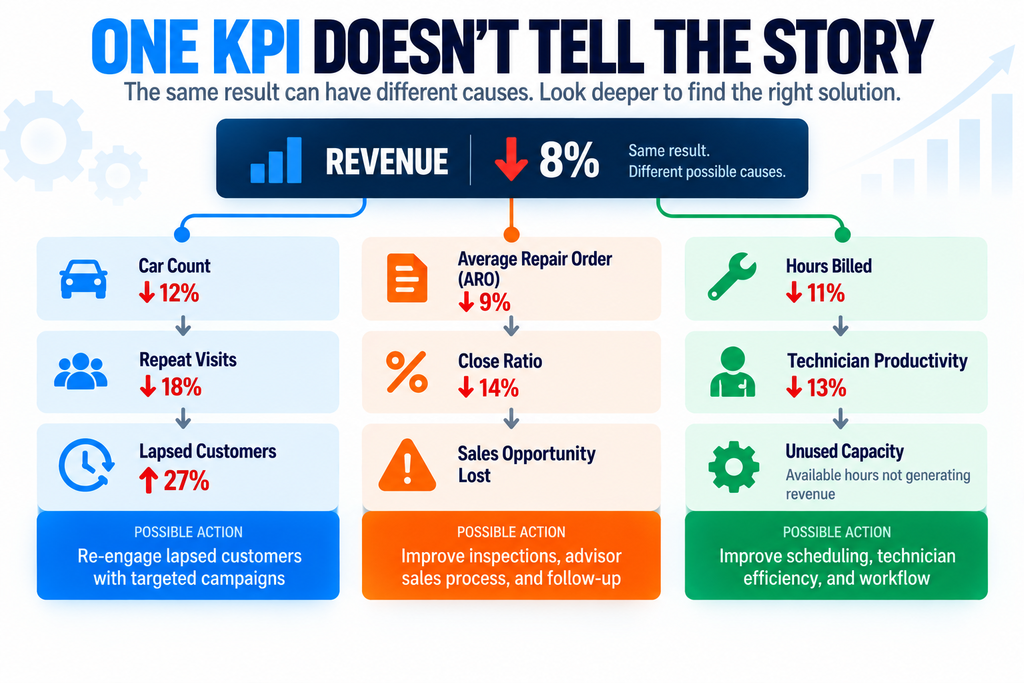
This is where KPI reporting becomes much more valuable.
Instead of looking at isolated numbers, look at how they move together.
Scenario 1: Revenue Is Up
Suppose revenue increased.
But then you discover:
Revenue ↑
Car Count ↑
ARO ↓
Gross Profit % ↓
Revenue increased, but the shop needed substantially more repair orders to produce that growth while generating a lower average ticket and lower gross margin.
That tells a very different story.
Scenario 2: Technician Efficiency Is Excellent
Your technician has excellent efficiency.
But:
Efficiency ↑
Productivity ↓
Proficiency ↓
The technician performs work quickly once assigned a repair but isn’t receiving enough productive work throughout the day.
The bottleneck may not be technician performance at all. It could be dispatching, scheduling, parts, inspections, approvals, or car count.
This is why it’s important to identify the actual bottlenecks in your auto repair shop instead of assuming the most visible metric is the problem.
Scenario 3: Google Ads ROAS Looks Great
Your Google Ads dashboard shows excellent ROAS.
But:
Reported ROAS ↑
New Customers ↓
Branded Search Spend ↑
The campaign may be capturing more searches from people who were already looking for your shop rather than creating incremental customer acquisition.
This is one of the reasons it’s important to understand how branded Google Ads traffic can affect your advertising results.
Scenario 4: ARO Is Increasing
Your ARO increased significantly.
But:
ARO ↑
Close Ratio ↓
Car Count ↓
Customer Retention ↓
Increasing ARO alone isn’t enough to conclude that sales performance is improving.
You need to understand what’s driving the change.
How Does Your Shop Compare? Understanding Auto Repair KPI Benchmarks
Once you start measuring KPIs consistently, it’s natural to ask:
Is this number good?
Industry benchmarks can provide useful context, but they should be used carefully.
Auto repair shops vary significantly by shop type, vehicle specialization, geography, labor rates, service mix, staffing model, customer demographics, shop capacity, and measurement methodology.
Even the formulas used to calculate certain automotive KPIs can vary between software systems, consultants, and industry organizations.
That’s why an industry benchmark shouldn’t automatically become your shop’s target.
A better approach is to compare three things:
Your Historical Performance → Industry or Peer Benchmarks → Your Shop’s Target
Your historical performance tells you where you’ve been.
Industry benchmarks provide outside context.
Your target defines where you’re trying to go.
For example, if technician proficiency is currently 58%, your historical average was 55%, and your next target is 65%, those numbers may be more immediately actionable than simply knowing what another shop produces.
Benchmarks are valuable.
But improvement requires context.
Build an Auto Repair Shop KPI Scorecard
You don’t need a dashboard containing 100 numbers to understand your business.
In fact, too many metrics can make it harder to see what’s actually important.
Instead, consider creating a focused scorecard with a few primary KPIs supported by diagnostic metrics.
| Category | Primary KPI | Supporting KPIs |
|---|---|---|
| Sales | Revenue | Car Count, ARO, Close Ratio |
| Labor | Proficiency | Productivity, Efficiency, Utilization |
| Profitability | Gross Profit | GP %, GP Per Billed Hour |
| Customer | Retention | Repeat Rate, Visit Frequency, Lapsed Customers |
| Marketing | CAC / ROAS | CPL, Lead-to-Appointment Rate, Revenue by Source |
The primary KPI tells you where to look.
The supporting metrics help you understand what’s causing the change.
Move From Reporting to Diagnosis
Traditional reporting is good at answering:
What happened?
Revenue was $300,000. ARO was $742. Technician proficiency was 68%. Customer retention was 61%.
Those numbers are useful, but they don’t tell you why they changed or what to do next.
If revenue declines 8%, the underlying data might reveal:
Revenue ↓ → Car Count ↓ → Repeat Visits ↓ → Lapsed Customers ↑
That points toward a customer retention problem.
Or it might show:
Revenue ↓ → Hours Billed ↓ → Productivity ↓ → Available Capacity Unused
That’s a completely different problem that could point toward scheduling, workflow, dispatching, or another operational bottleneck.
The same applies when KPIs improve. Understanding why something worked helps you identify what you should continue or repeat.
The real value of shop analytics isn’t simply knowing whether a number went up or down.
It’s understanding why it changed.
Ask Your Shop Data Questions
That’s what we’re building HiBeam’s natural language answer engine to do.
Instead of digging through reports and connecting the numbers yourself, you can ask questions about your business in normal language:
“Why did revenue decrease last month?”
“What caused our ARO to increase?”
“Why did technician proficiency drop?”
“Are we losing more customers than six months ago?”
“How much revenue opportunity is sitting in declined services?”
HiBeam analyzes the underlying shop data and relationships between KPIs to help identify what’s driving the change.
That moves analytics beyond reporting:
Metric → Change → Cause → Opportunity → Action
Turn Your Shop Data Into Action
Finding the cause is only useful if you can do something about it.
If retention is declining, which customers are driving the change?
If productivity is falling, where is productive time being lost?
If ARO increased, what changed and can it be repeated?
If declined service opportunity is growing, where are the best opportunities to recover revenue?
HiBeam connects your metrics to the customers, repair orders, services, technicians, locations, and marketing activity behind them.
Instead of simply telling you what happened, HiBeam helps you understand why it happened, where the opportunity is, and what to do next.
Turn Shop Data into Answers. Answers into Action.
Turn your shop data into answers and actionable intelligence you can use to improve your business.
Auto Repair Shop KPI FAQs
The most important KPIs depend on what you’re trying to measure, but a useful shop scorecard should cover sales, labor, profitability, customers, and marketing.
Important metrics include revenue, car count, ARO, close ratio, gross profit, technician productivity, efficiency and proficiency, Effective Labor Rate, customer retention, Customer Acquisition Cost, and ROAS.
The key is not simply tracking each number. It’s understanding how they affect one another.
Some operational KPIs should be reviewed daily or weekly, while broader financial, customer retention, and marketing trends may be more useful when reviewed monthly, quarterly, or across rolling periods.
The right frequency depends on how quickly the metric changes and whether you have enough data to make the comparison meaningful.
There isn’t one ARO that is appropriate for every auto repair shop.
ARO can vary significantly based on labor rates, vehicle specialization, geography, service mix, customer base, and the type of repairs being performed.
Your historical performance, relevant peer benchmarks, profitability, and business targets provide better context than relying on a single industry-wide number.
Productivity measures how much clocked technician time is spent actively working on repair orders.
Efficiency compares billed hours with the actual time spent working on those repair orders.
Proficiency compares billed hours with total available technician hours.
Together, they provide a much better picture of labor performance than any one metric by itself.
No single KPI can tell you whether the entire shop is performing well.
Revenue could increase while profitability falls. ARO could rise while retention declines. Technician efficiency could improve while productive time decreases.
A better approach is to evaluate sales, labor, profitability, customer, and marketing KPIs together and investigate what’s causing meaningful changes.
Author: Chris Matson is the Founder of HiBeam and an experienced automotive business and marketing professional. Since 2009, he has owned and operated independent auto repair shops while building an automotive-focused marketing agency. Earlier in his career, he served as CFO of a broadcast television group, adding financial and business leadership experience to his hands-on automotive and marketing background. Chris writes about automotive marketing, customer retention, communication, and strategies that help repair shops grow revenue.